Do you have problems with wifi? Or do you want to know how far wireless signals reach in your home? Use a tool that creates heat maps.
What is a Wifi Heat Map?
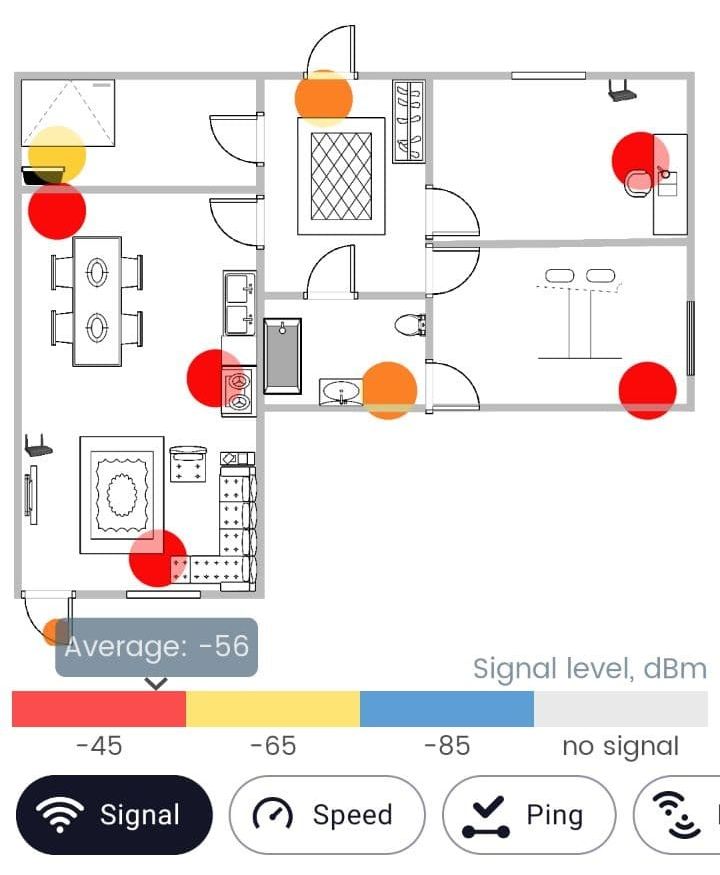
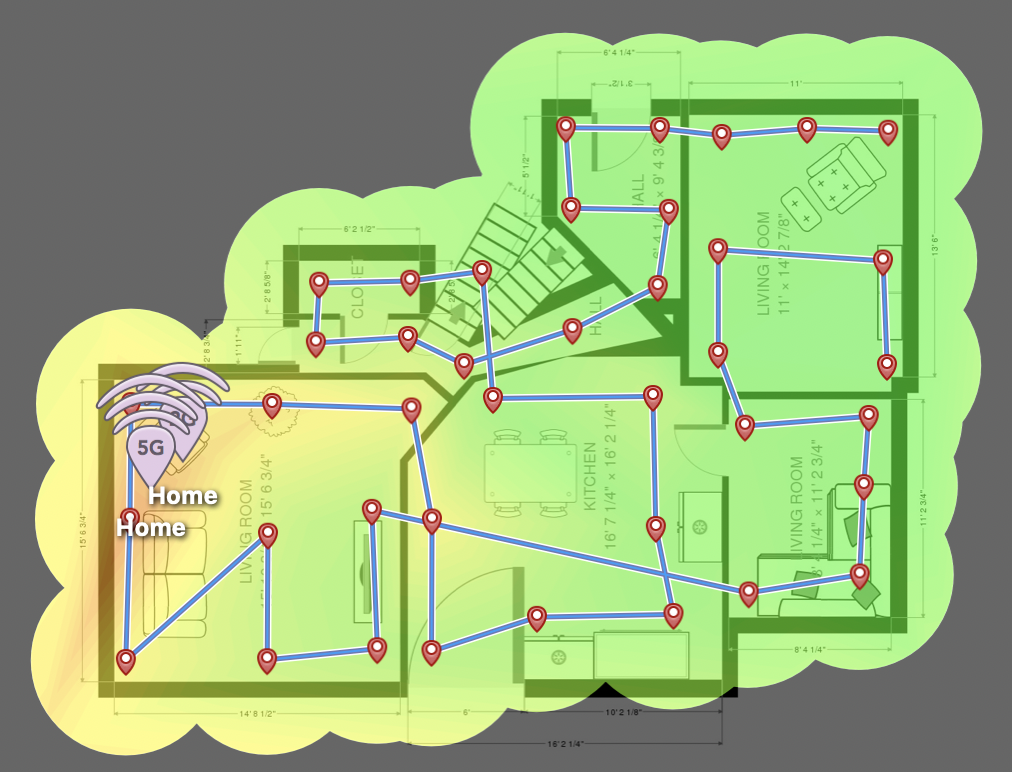
A heat map shows the wireless coverage / signal strength in an area using color, where good wireless coverage will usually appear as green, while weak to no coverage will be red.
Heatmap tools for wifi usually start from blueprints or floor plans – you will get the best and most precise result if you have a blueprint for the home at hand.
Why heat mapping and not just speed testing?
Heatmappers and speed tests are complementing tools that together give a better overview.
- A heat map visualizes the signal strength in a certain area and provides an indication of where you can expect to achieve the best wireless coverage. If you create multiple maps, you can compare before and after any changes you make. You can also see how conditions change continuously due to external influences.
- A speed test only tells you the maximum achievable speed with the speed test and device you are using, for the exact location you are on at the exact moment you are running the test.
If you take your time and do it right, a heat map and a speed test can tell you where in the home signals are good and bad, as well as the speeds you can achieve where the signal is good or bad.
For more on how to complete a thorough test of a wifi solution, see Testing Wireless: Reality Check for Wi-Fi solutions.
What tools can you use to create heatmaps?
We recommend these heatmappers:
Free:
- Android: WiFi Heatmap – network analyzer & signal meter https://play.google.com/store/apps/details?id=ua.com.wifisolutions.wifiheatmap&hl=en
- Linux: Wi-Fi sigmap https://code.google.com/p/wifisigmap/
NetSpot http://www.netspotapp.com/ is a premium app available for Mac OS X, Windows, Android, and iOS.
Tips & Tricks
The heatmapper programs are quite intuitive, you just need to be connected to your wireless network and follow the instructions for the program you have chosen.
If you don’t have a blueprint available for the area you are mapping, try to draw a simple floor plan / room layout yourself.
It is important to make sure measurements are made close to each other so that the measuring ranges overlap.
Article by Jan Pedro Tumusok and Jorunn Danielsen